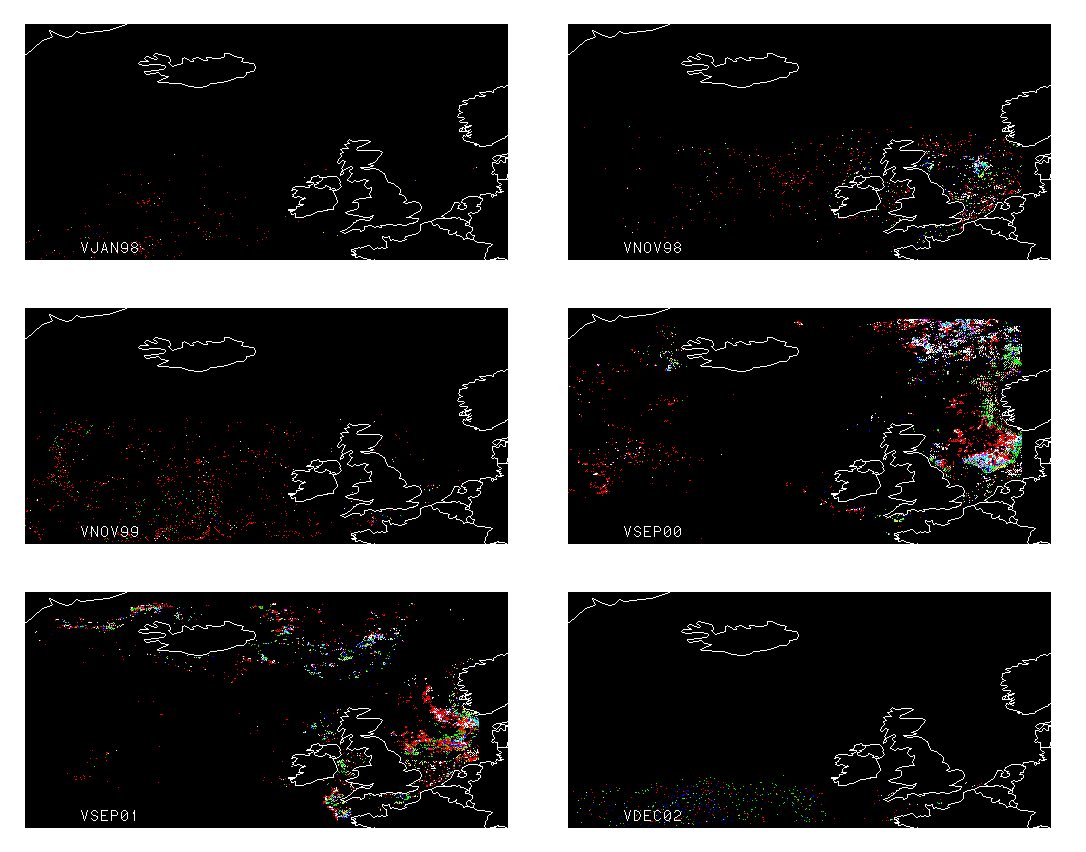
Colors describe areas of anomalies in simultaneous above-average sea surface chlorophyll concentration (Chl-a, SeaWiFS)
and below-average sea surface temperature distribution (SST, AVHRR). Animated image shows the spatiotemporal distribution
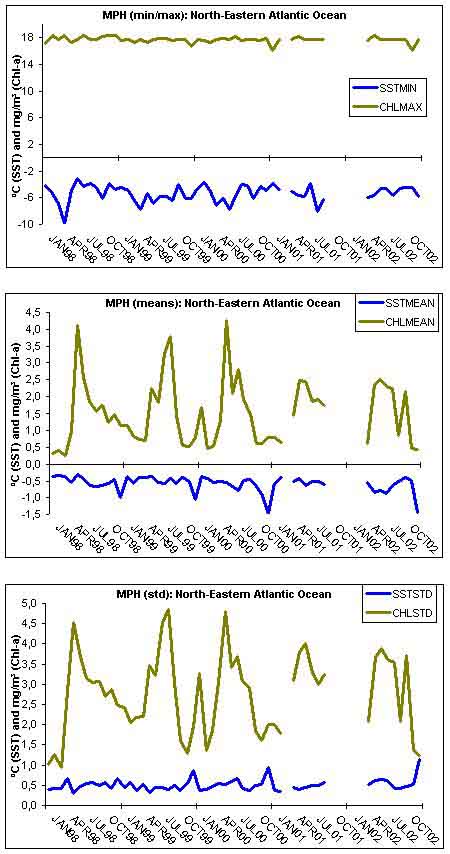
of persistent marine productivity along the ICES Area (English Channel, Irish Sea, Scottish waters and North Sea). Graph shows
the mean monthly levels of Chl-a and SST.

