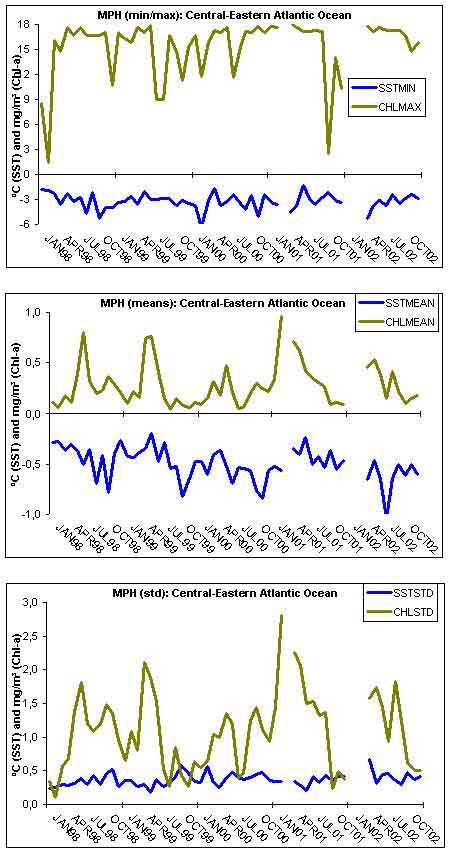
Colors describe areas of anomalies in simultaneous above-average sea surface chlorophyll concentration (Chl-a, SeaWiFS)
and below-average sea surface temperature distribution (SST, AVHRR). Animated image shows the spatiotemporal distribution
of well-known upwelling regions along the Saharan Bank and Portugese coast. Graph shows the mean monthly levels of Chl-a and SST.