A variety of datasets was incorporated into GIS databases for the study of commercially-important Cephalopod species in the project's study areas (NE Atlantic, Portugal Coast, Saharan Bank, SE Mediterranean, and SW Atlantic). These datasets include georeferenced time-series information on species catch and landings, species life-history data, various environmental data (sea surface temperature, sea bottom temperature, sea surface salinity, sea bottom salinity, sea surface chlorophyll-a concentration, sea surface currents, and wind patterns) and derived oceanographic products (classified surface waters, sea surface anomaly, and temperature fronts) as well as species biological and genetic data. Time-series of satellite imagery from AVHRR (Advanced Very High Resolution Radiometer), CZCS (Coastal Zone Color Scanner), SeaWiFS (Sea Wide Field-of-view Sensor), and TOPEX-Poseidon was referenced and used in GIS analysis.
Display, overlay, and integration of fishery, survey and environmental data are performed via four major GIS developments:
These systems are described by 2 major GIS architectures: [1] - [2].
The systems are based on a GIS server (ARC/INFO or ArcView), they contain a multidisciplinary GIS database (ARC/INFO covers, grids or INFO tables as well as ArcView themes and tables and/or Access tables) and they feature a user-interface for automated feature selection and dataset integration routines developed in AML (Arc Macro Language) or Avenue.
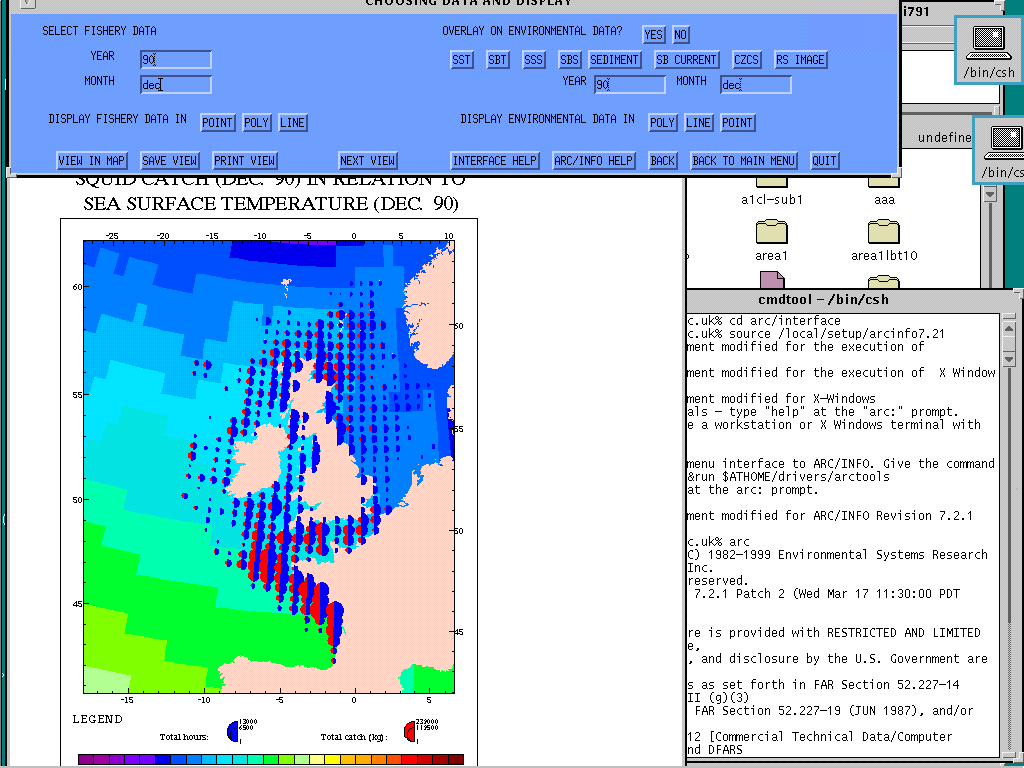
Developed interfaced routines are placed in three categories:
These marine systems are used for answering specific spatio-temporal questions on Cephalopod population dynamics (e.g. where are species spawning grounds, where do they aggregate, where are the major fishing areas, where are their seasonal suitable habitats, how they seasonaly move or migrate, etc.). To answer such questions, species known life-history data are extensively used. These data are important in the GIS integration analyses because they provide information on species populations certain characteristics, such as maximum depth occurence, spawning substrate types, spawning depth and temperature ranges, migration habbits, etc.).
Following, three sets of example output from marine GIS analysis routines (one for each category mentioned above) are presented:
Currently, these marine GI systems are used by GIS-oriented marine biologists for scientific purposes. However, further interface developments are in cource for use of the systems as monitoring and decision-support tools by fisheries officials and policy-makers. The ability of GIS technology to store, update, and integrate different sources of marine data is ideal for the development of such applications for marine species monitoring and resource management-aid tools.
Differences in architecture system design focus on software and programming developments as well as specific-task oriented analysis.
![[1]](image001.gif)
![[2]](image012.gif)